Sensor chips
Sensor chips are the compact cards across the top of most dashboards, such as Total Miles, Usable Capacity, and Home Charging. Each shows one main value. It can also carry a smaller value beside it, a line of text beneath it, and a small graph behind it. Every chip, built-in or new, is built from the same settings, so anything a built-in chip does, you can do too.

Anatomy of a chip
Using Usable Capacity (top row, third from left) as the example:
- Title (
USABLE CAPACITY) and an optional label suffix in smaller text (now/new). - Icon in the top right corner.
- Main value (
134.1 kWh), the number the chip is about. - Inline value (
/135.0 kWh), a smaller related value beside the main one. - Secondary line, an optional line of text under the value, such as
Home 43.5 kWh / Away 73.5 kWhon the Charging dashboard's Home Charging chip. - Background graph, an optional line, area, or bar graph behind the value, such as the bars behind Total Miles on the Overview.
- Badges. Lifetime marks a chip that counts your whole history instead of the dashboard's selected dates. A ? beside a title opens an explanation of how that value is calculated.
Add or edit a chip
- Enter edit mode.
- To add a chip, pick one under Sensors in the drawer's Add widget catalog. To change one, click its pencil.
- Adjust the sections described below. The chip updates as you type.
- Press Save in the drawer's top bar.
The built-in chips in the Sensors catalog come already set up. The fastest way to build something new is often to add a built-in chip that is close to what you want, then change it.
Identity and visibility
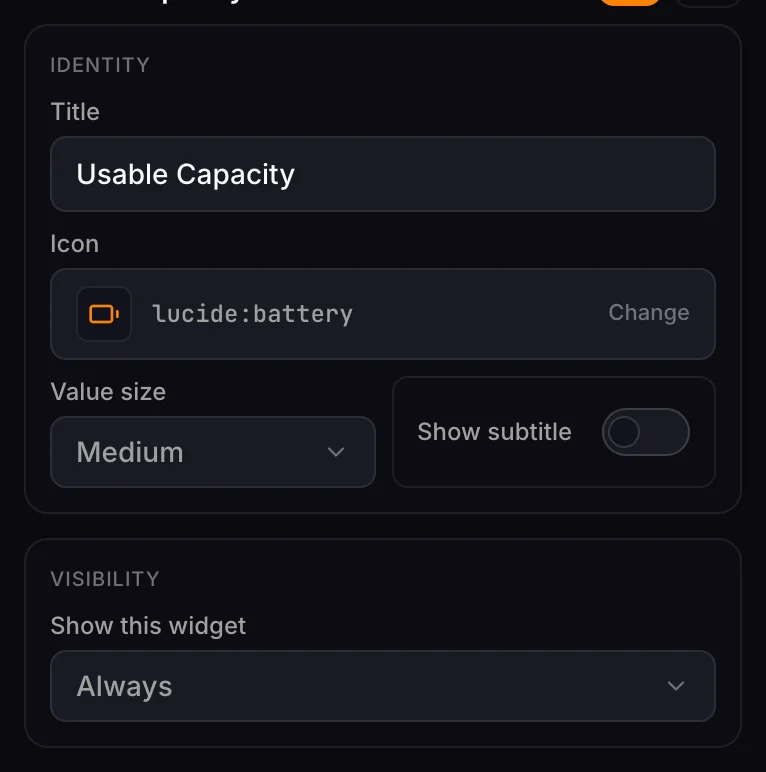
- Title is the label across the top of the chip.
- Icon: press Change to search thousands of icons by name. Filter the results by icon set: Lucide, Material, Heroicons, Phosphor, or Tabler.
- Value size makes the main value Small, Medium, or Large.
- Show subtitle adds a line of your own text to the chip.
- Show this widget: Always, Vehicle plugged in, or Vehicle unplugged. See Show a widget only when plugged in or unplugged.
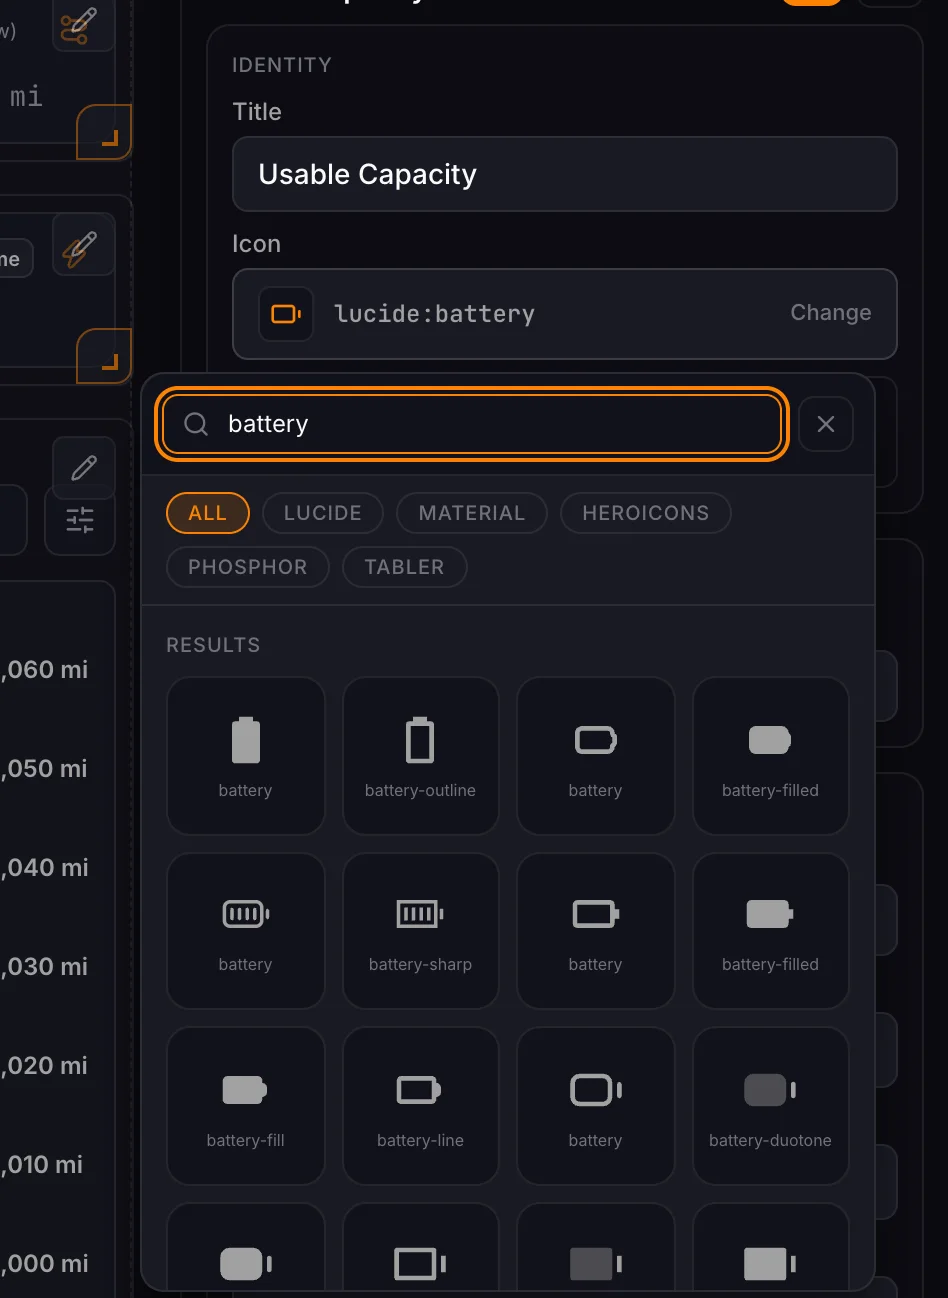
Icon search runs through your Riviamigo server, using the Iconify connection in Settings > External Connections. With that connection off, chips keep the icons they already have, but you can't search for new ones.
Choose the value
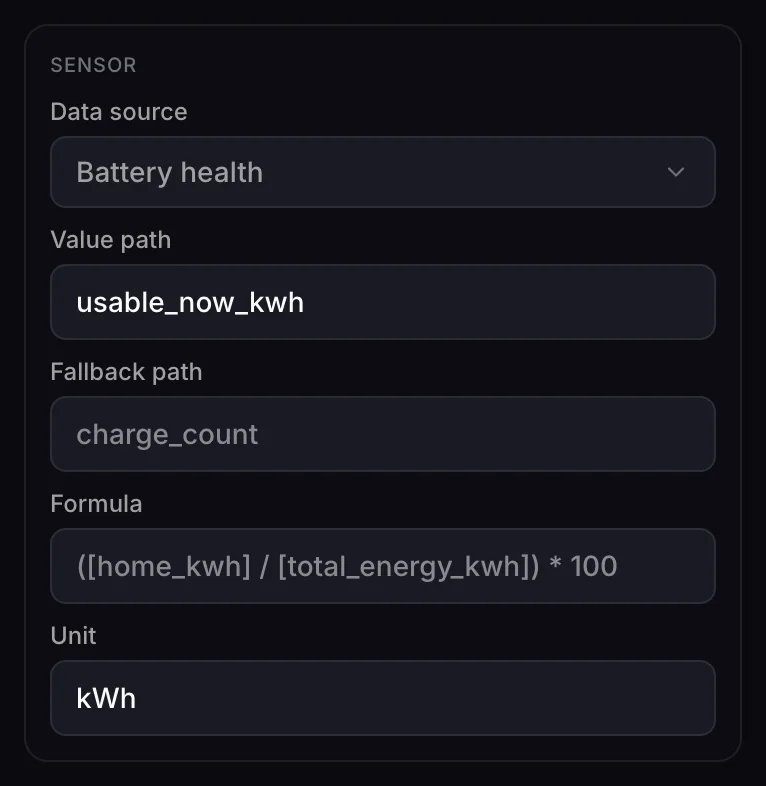
The Sensor section decides which number the chip shows. Start with a Data source:
| Data source | What it reads | How you pick the value |
|---|---|---|
| Metric catalog | Trip, charging, and telemetry metrics for the dashboard's selected dates | Choose a Metric |
| Battery health | The battery health summary | A value path or a formula |
| Charging summary | Charging totals for the dashboard's selected dates | A value path or a formula |
| Vehicle status | The vehicle's latest live status | A value path or a formula |
Metric catalog
Pick a Metric. Riviamigo calculates its value for the dashboard's selected dates. For example, Total Miles is the distance driven in that range, and Battery Level is the latest reading. The Aggregation choice (Latest, Sum, Average, or Count) is saved with the chip but doesn't currently change the value shown.
The metrics are Total Miles, Trip Miles, Total Trips, Energy Charged, Charging Sessions, Total Cost, Avg Session Energy, Avg Efficiency, Avg Gross Efficiency, Avg Outside (estimated), Avg Trip Duration, Battery Level, Estimated Range, Odometer, Outside Temp, Speed, Power, and the pressure of each tire.
Battery health, Charging summary, and Vehicle status
These sources each provide a set of named fields. Point the chip at one of them, or combine several with a formula.
-
Value path is the field to show, such as
usable_now_kwh. -
Fallback path is a second field, used when the first has no value.
-
Formula calculates the value from several fields instead. When a formula is set, it is used in place of the value path. See Formulas.
-
Unit formats the result. Use one of these units, and Riviamigo formats the value, converting it to the units in Settings > Units where they apply:
Unit Formatted as miDistance (miles or kilometers) mphSpeed CTemperature (stored in Celsius; shown in your unit) psiPressure kWh,kWEnergy, power Wh/miEfficiency USDCurrency minDuration %Percentage Any other unit, or none, shows the plain number.
The fields each source provides are listed in Field reference at the end of this page.
Formulas
A formula is plain arithmetic over fields. Wrap each field name in square brackets:
([home_kwh] / [total_energy_kwh]) * 100
- Use
+,-,*,/, parentheses, and numbers. [status.<field>]reads the vehicle's live status from any chip, whatever its data source. For example,[status.range_miles]works in a Battery health chip.- If a field has no value, or the formula divides by zero, the chip shows
-instead of a wrong number. - Formulas can only do arithmetic. They can't run code or reach anything outside Riviamigo.
Wording, inline values, and the secondary line
The Display Language section adds the smaller pieces around the main value.
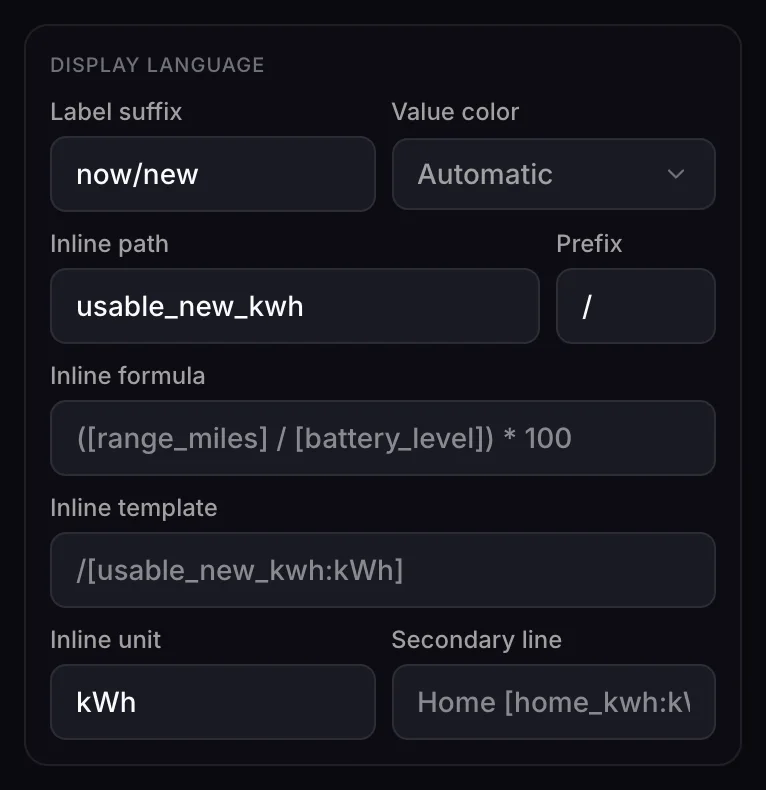
- Label suffix adds small text after the title, such as
now/new. - Value color: Accent uses the theme's accent color, Default uses the normal text color, and Automatic, offered for chips that belong to a data category such as charging or battery, uses that category's theme color.
- Inline value sits beside the main value. Fill in one of these. If you
fill in more than one, the template wins, then the formula, then the path.
- Inline path, Prefix, and Inline unit: one field with a prefix,
for example
/andkWhto show/135.0 kWh. - Inline formula (with Prefix and Inline unit): a calculated value.
- Inline template: free text with fields in it. See Templates.
- Inline path, Prefix, and Inline unit: one field with a prefix,
for example
- Secondary line is a template shown on its own line under the value.
Templates
A template is text with fields dropped in. Write each field as
[field:unit]. The unit is optional and uses the same unit codes as above, or
int for a whole number:
| Template | Shows |
|---|---|
Home [home_kwh:kWh] / Away [away_kwh:kWh] | Home 43.5 kWh / Away 73.5 kWh |
([charging_cycles:int] cycles) | (12 cycles) |
/[usable_new_kwh:kWh] | /135.0 kWh |
If any field in a template has no value, the whole template is left blank, so a chip never shows half a sentence.
Background graph
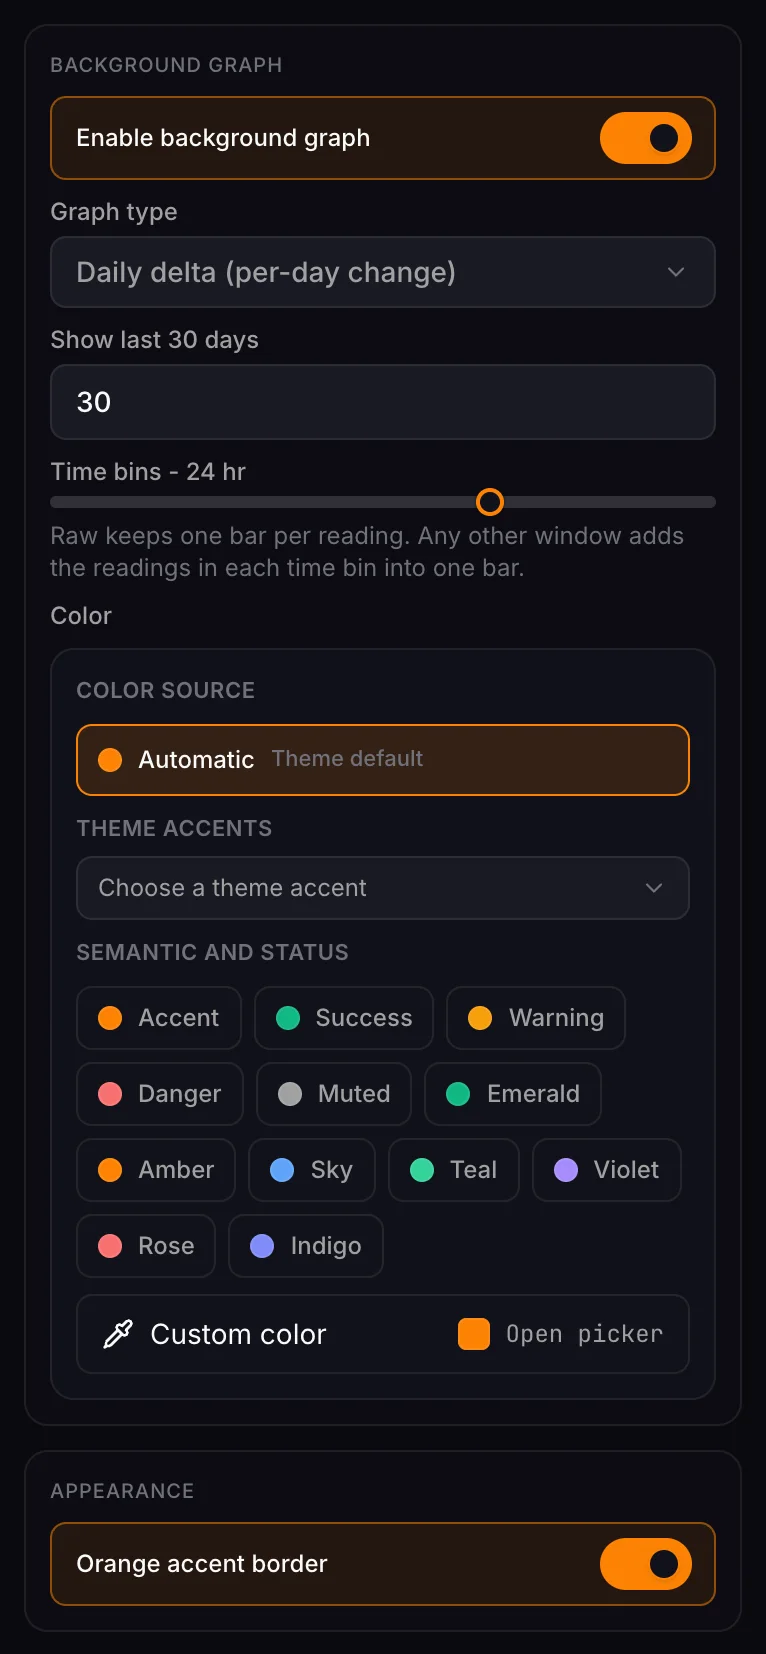
Turn on Enable background graph to draw the chip's metric behind its value, over the dashboard's selected dates. Graphs are drawn for Metric catalog chips. Chips that read Battery health, Charging summary, or Vehicle status have no series to draw.
- Graph type:
- Line and Area draw the readings as a line, or as a line with the area under it filled.
- Bar draws one bar per reading or per time bin.
- Daily delta (per-day change) draws one bar per day for how much the value changed that day. It suits running totals: on Total Miles, each bar is the miles driven that day. Show last N days sets how many days to draw, from 1 to 365.
- Smoothing (Line and Area): goes from Off (readings joined by straight lines) and Curve (a rounded line through the same readings) through time windows from 15 minutes to 7 days, which average the readings over that window. Smoothing only changes the drawing, never the value on the chip.
- Time bins (Bar and Daily delta): Raw keeps one bar per reading. Any other window adds the readings in each time bin into one bar.
- Color: Automatic follows the theme, or pick a theme accent, a status color, or any custom color.
Appearance
Orange accent border outlines the chip in the accent color to make it stand out, like Total Miles on the Overview.
Recipes
Share of charging done at home
On the Charging dashboard, add a chip and set:
- Data source: Charging summary
- Formula:
([home_kwh] / [total_energy_kwh]) * 100 - Unit:
% - Secondary line:
Home [home_kwh:kWh] / Away [away_kwh:kWh]
Average tire pressure
- Data source: Vehicle status
- Formula:
([tire_fl_psi] + [tire_fr_psi] + [tire_rl_psi] + [tire_rr_psi]) / 4 - Unit:
psi - Inline template:
low [tire_min_psi:psi]
Range per percent of charge
- Data source: Vehicle status
- Formula:
[range_miles] / [battery_level] - Unit:
mi - Label suffix:
per 1%
Odometer with miles driven each day
- Data source: Metric catalog
- Metric: Odometer
- Background graph: Daily delta, last 30 days
The chip shows the odometer reading, and each bar behind it is one day's driving.
Field reference
These are the fields you can use in value paths, formulas, and templates.
Battery health
| Field | Meaning |
|---|---|
usable_now_kwh | Usable battery capacity now |
usable_new_kwh | Usable capacity when new |
battery_health_pct | Battery health, percent |
estimated_degradation_pct | Estimated degradation, percent |
charge_count | Number of charges |
charging_cycles | Full-equivalent charging cycles |
total_energy_added_kwh | Energy added by charging |
total_energy_used_kwh | Energy used |
charging_efficiency_pct | Charging efficiency, percent |
Charging summary (for the dashboard's selected dates)
| Field | Meaning |
|---|---|
total_energy_kwh | Energy charged |
total_cost_usd | Charging cost |
session_count | Charging sessions |
home_kwh, away_kwh, unknown_location_kwh | Energy by location |
away_kwh_including_unknown | Away energy plus energy at unknown locations |
ac_kwh, dc_kwh | Energy by AC and DC charging |
charging_cycles | Charging cycles |
charging_efficiency_pct | Charging efficiency, percent |
max_charge_limit_pct | Highest charge limit used |
max_charge_rate_kw | Fastest charge rate |
free_session_count | Sessions that cost nothing |
known_cost_session_count, unknown_cost_session_count | Sessions with and without a known cost |
rivian_paid_total_usd | Amount billed by the Rivian network |
Vehicle status (the latest live reading)
| Field | Meaning |
|---|---|
battery_level | State of charge, percent |
range_miles | Estimated range, miles |
battery_limit | Charge limit, percent |
battery_capacity_kwh | Battery capacity |
time_to_end_of_charge_min | Minutes until charging finishes |
speed_mph | Speed |
odometer_miles | Odometer |
altitude_m | Altitude, meters |
cabin_temp_c, driver_temp_c, outside_temp_c | Temperatures, Celsius |
tire_fl_psi, tire_fr_psi, tire_rl_psi, tire_rr_psi | Tire pressures |
tire_min_psi | Lowest tire pressure |
For how the underlying data is collected and stored, see the Metrics reference and Dashboard data map.