Edit a dashboard
Every Riviamigo dashboard (Overview, Battery, Charging, Trips, and Efficiency) is a grid of widgets you can rearrange and reconfigure. You can move and resize widgets, add new ones from a catalog, change what each one shows, and hide a widget unless the vehicle is plugged in or unplugged. Nothing changes until you press Save.
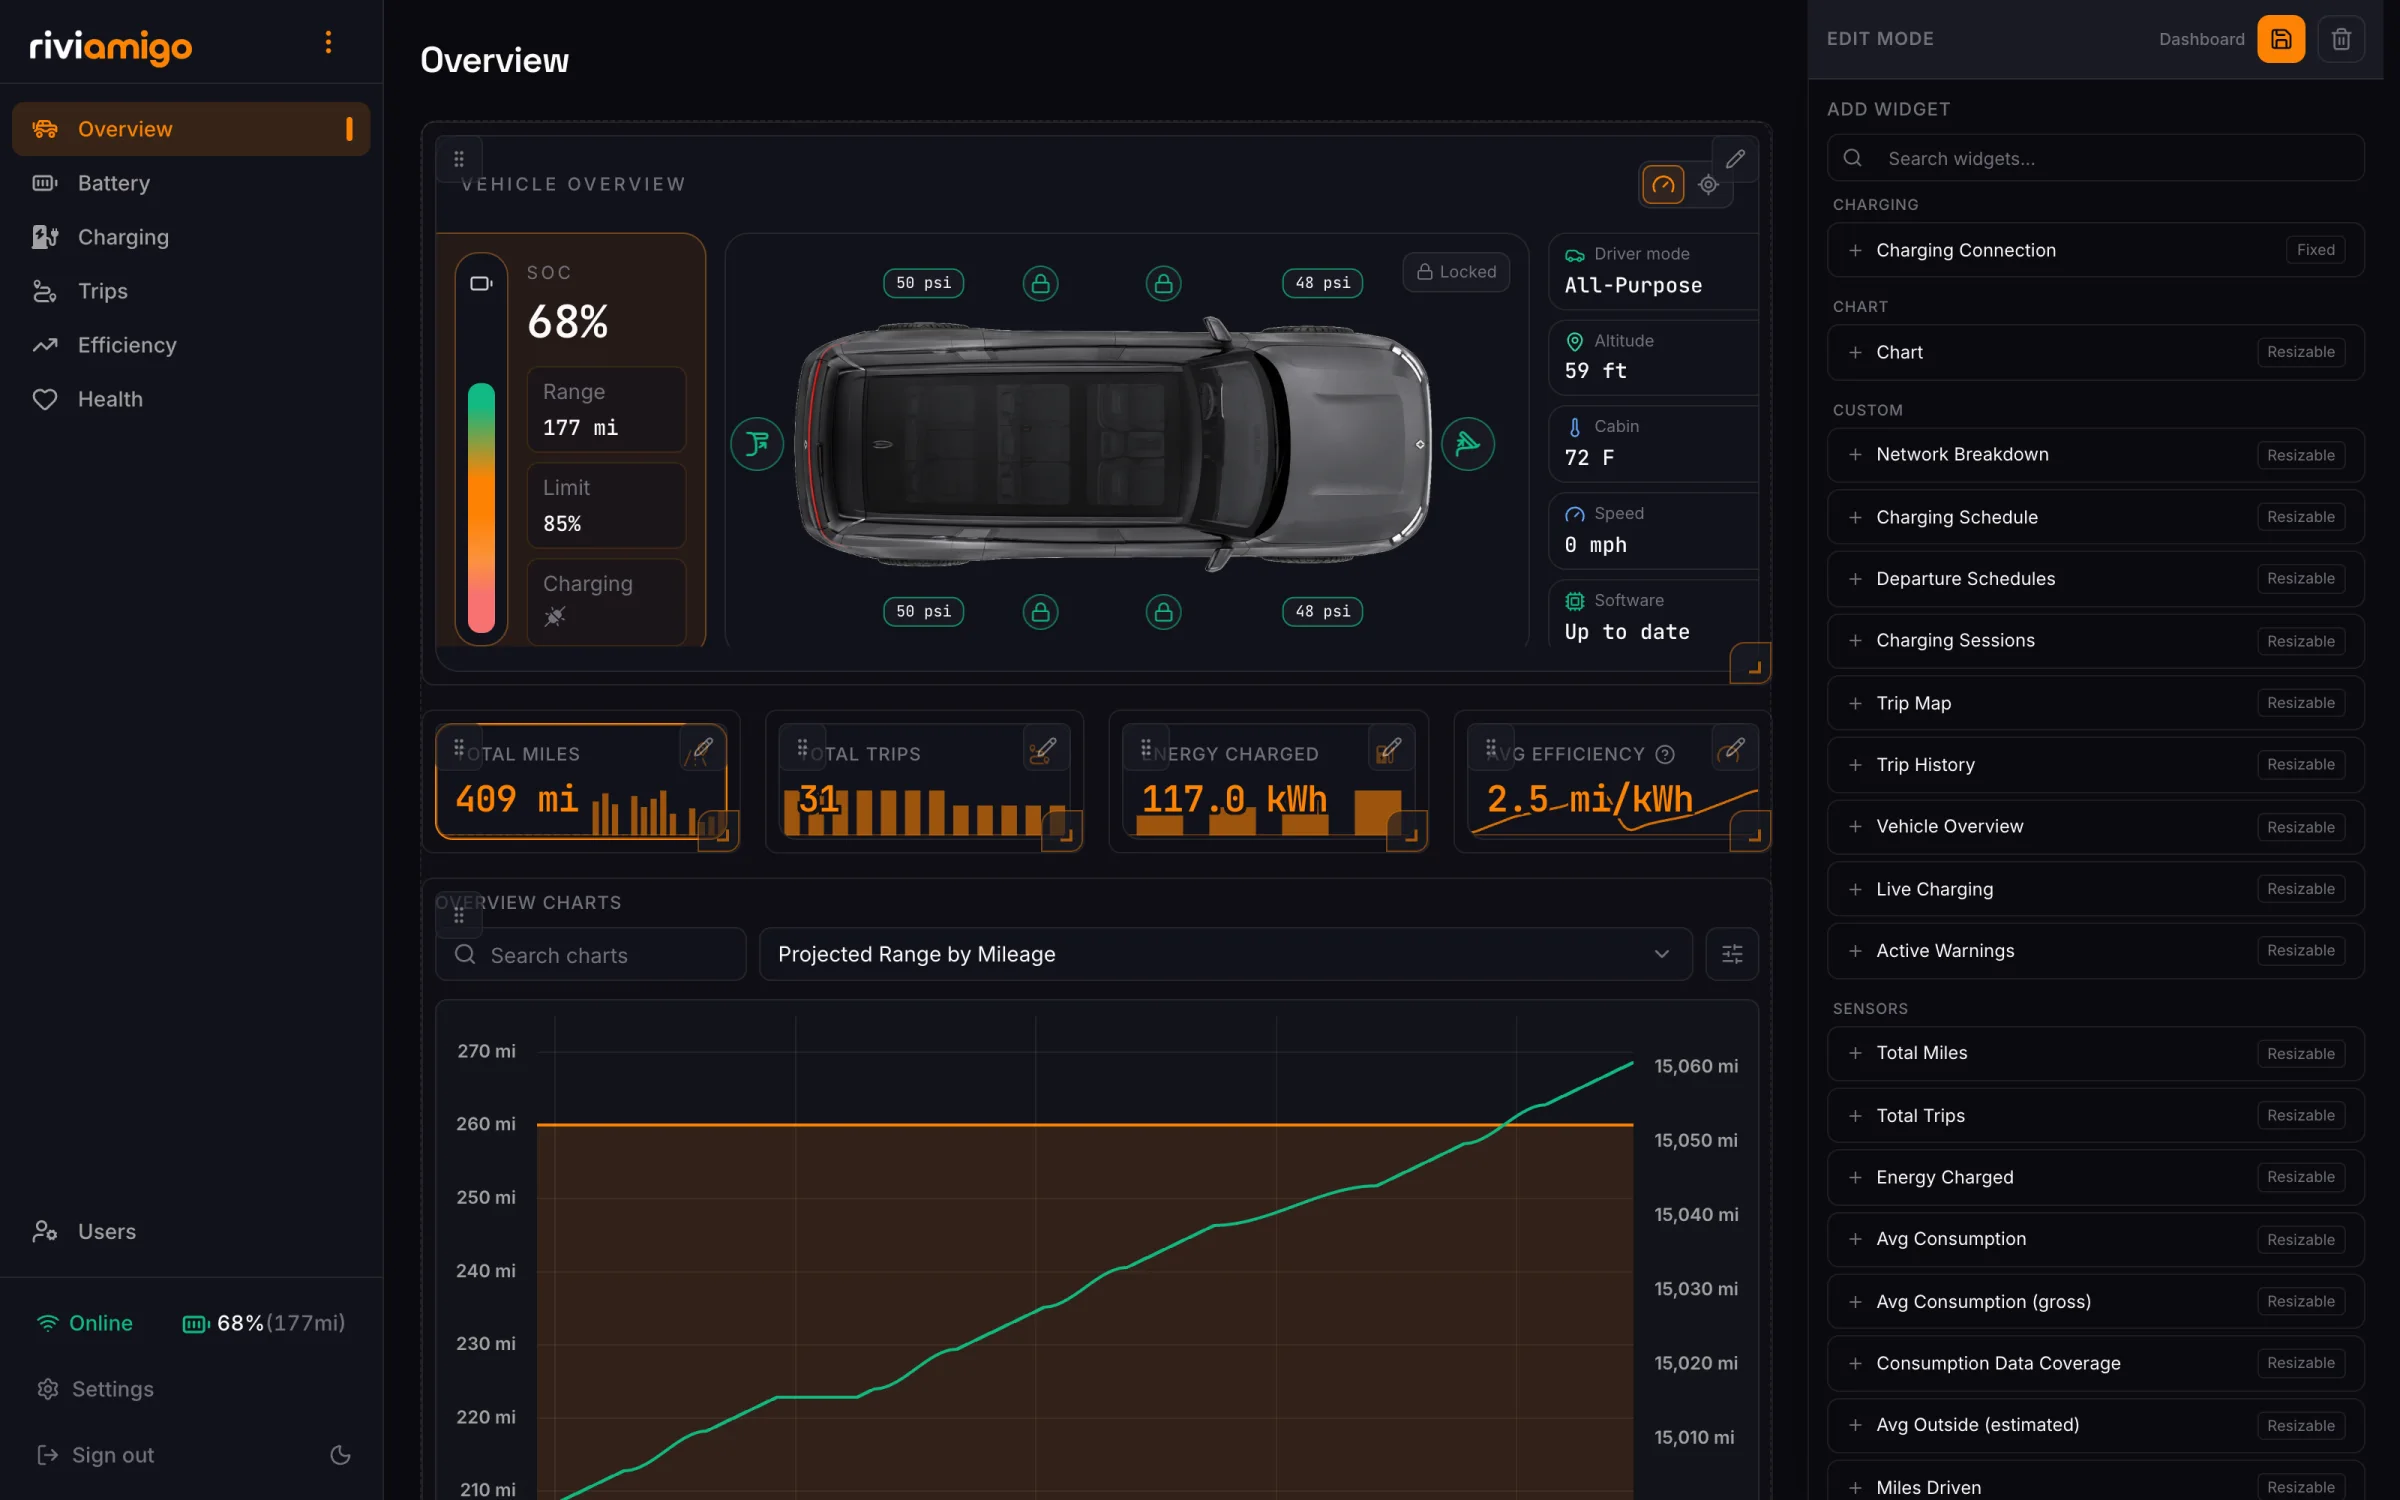
The grid holds four kinds of widget:
| Widget | What it is | Learn more |
|---|---|---|
| Sensor chips | Compact cards with one value, such as Total Miles or Usable Capacity, optionally over a small background graph. | Sensor chips |
| Vehicle Overview | The large panel at the top of the Overview page: battery, vehicle image, tire pressures, locks, five stat rows, and the location map. | Vehicle Overview |
| Charts | A chart with a dropdown of related charts, such as the Battery or Charging charts. | Chart widgets below |
| Custom widgets | Purpose-built panels such as Charging Connection, Charging Sessions, Trip Map, and Trip History. | Add a widget |
Turn on edit mode
There are two ways in:
- From the dashboard page. Open Settings > Dashboards and turn on Show edit button on dashboard pages. A pencil then appears next to each dashboard's title. Click it to start editing that page. The setting is per user, and it is off by default.
- From Settings. In Settings > Dashboards, use Edit default, Edit, or Customize on the dashboard you want to change. See Manage dashboards for what each one edits.
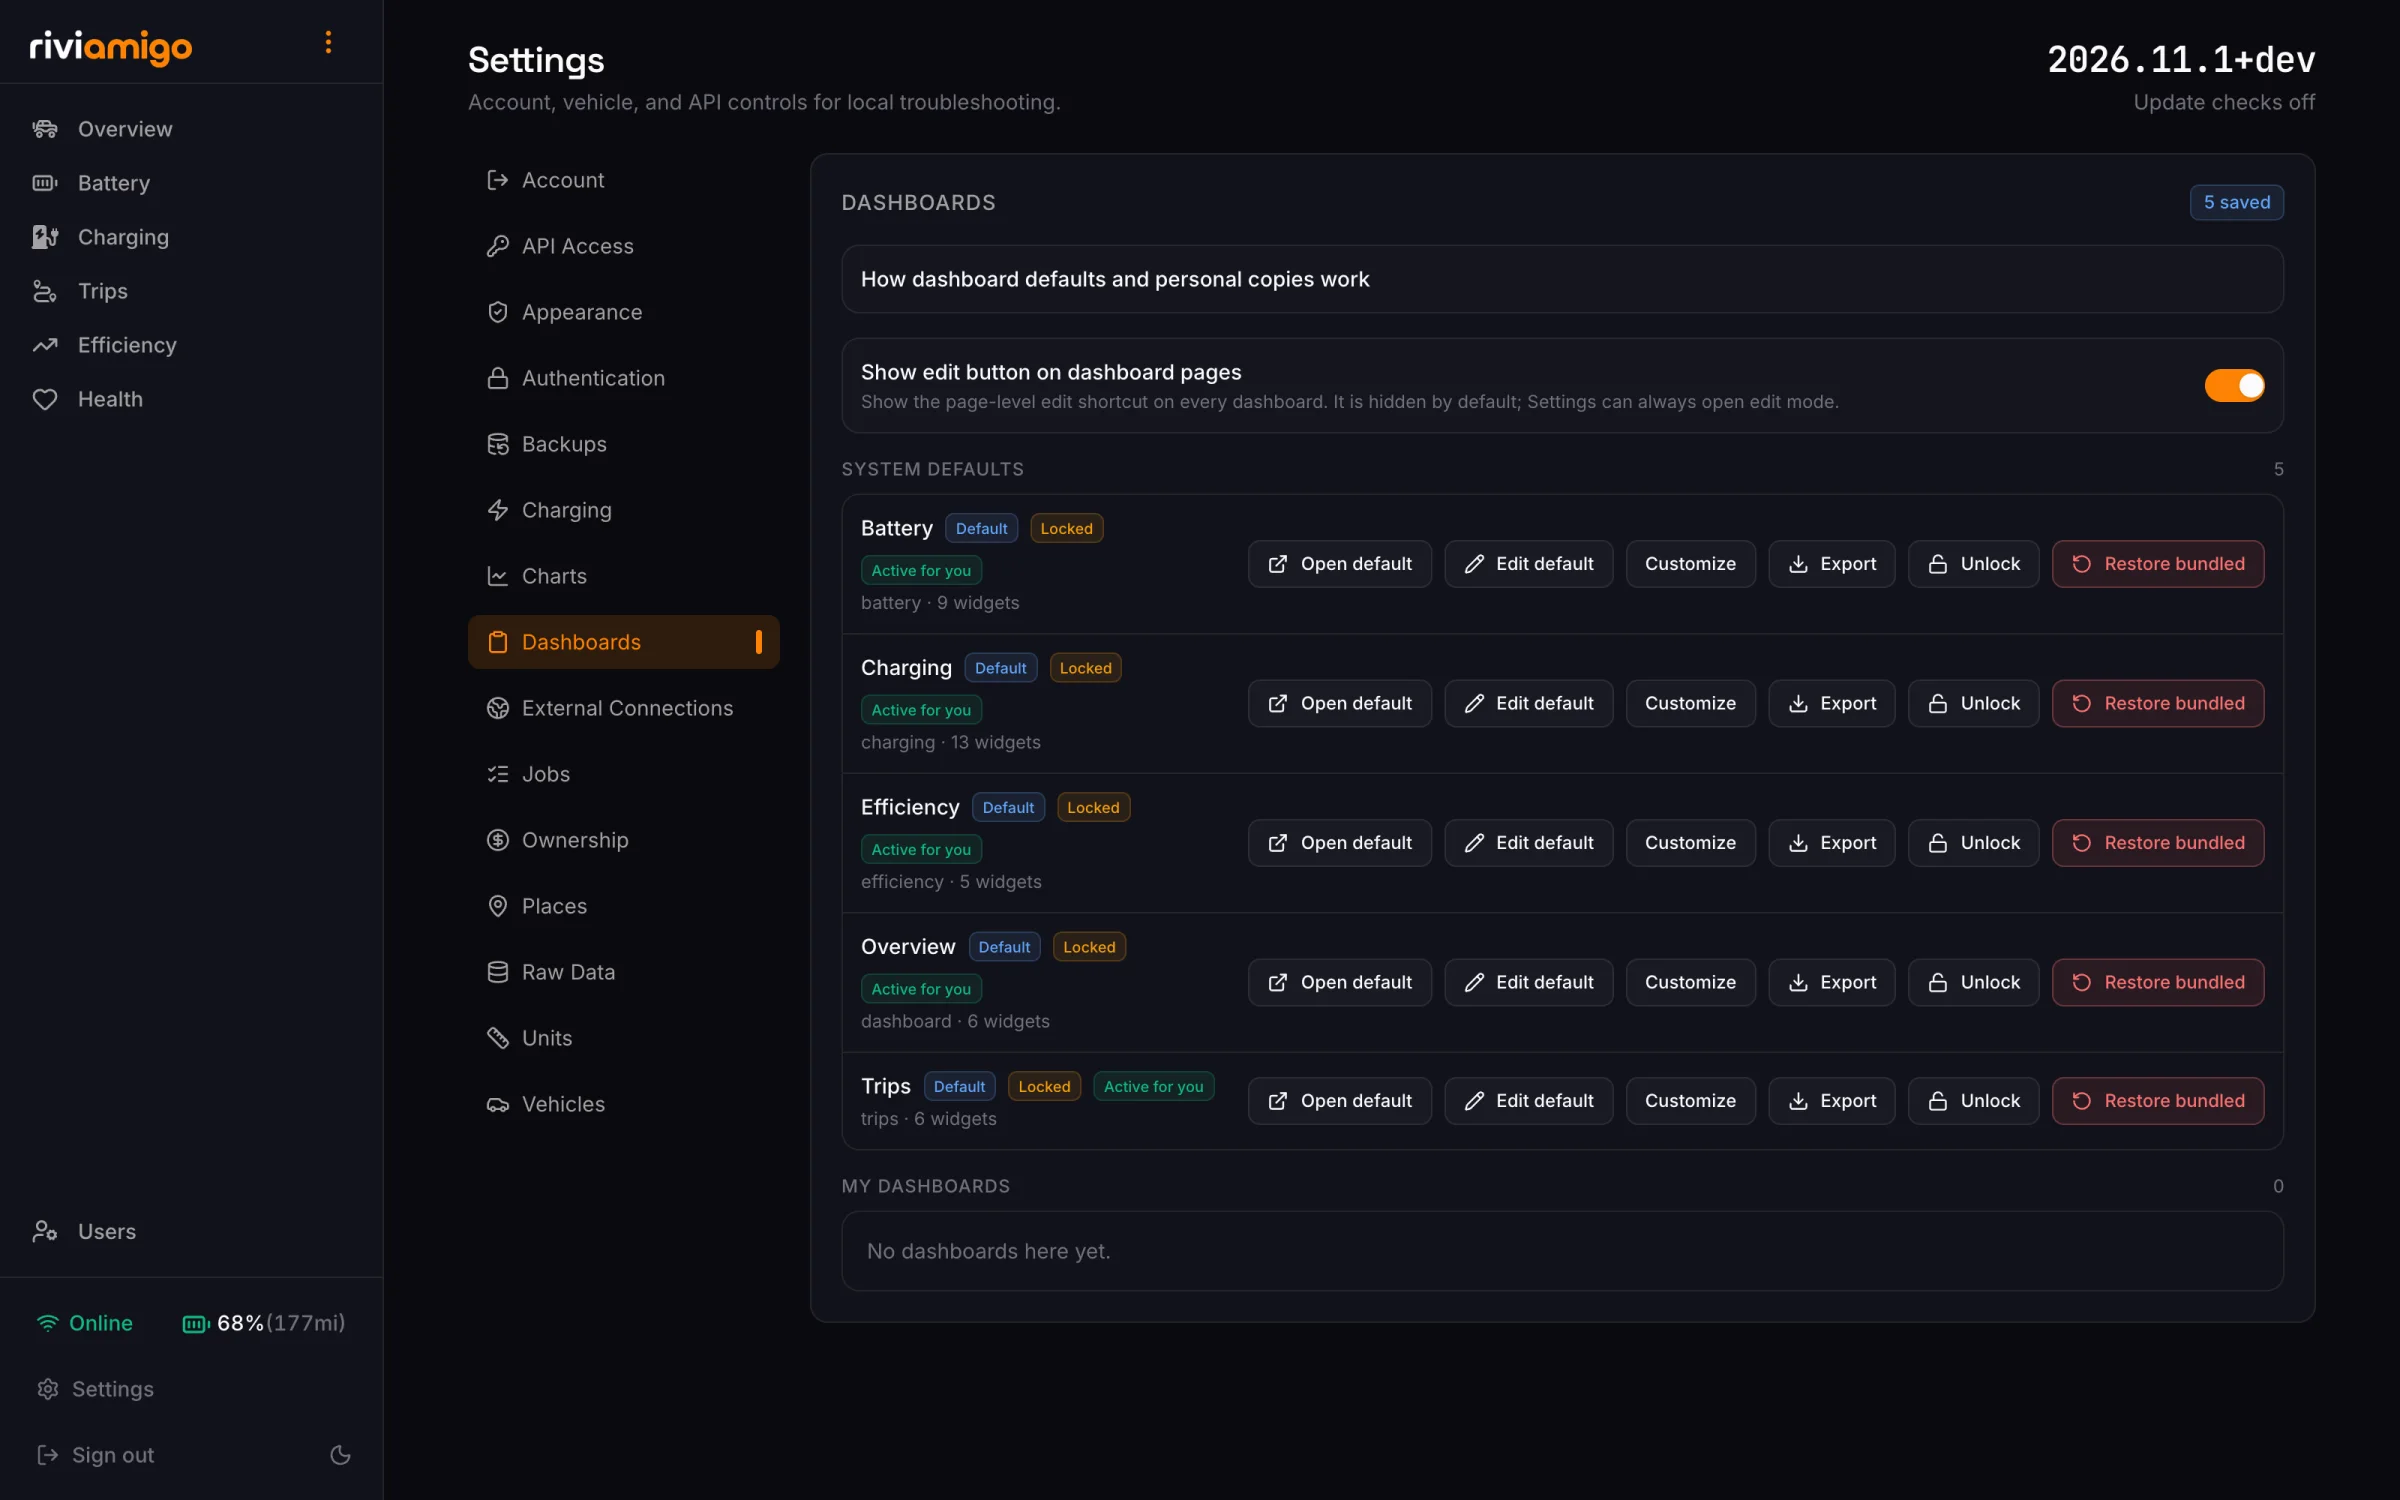
An owner or administrator who edits a built-in dashboard from its page changes the installation-wide default. Everyone who hasn't made a personal copy sees the change. Anyone else who edits a built-in dashboard gets a personal copy that only they see. To change only your own view as an administrator, choose Customize in Settings > Dashboards first.
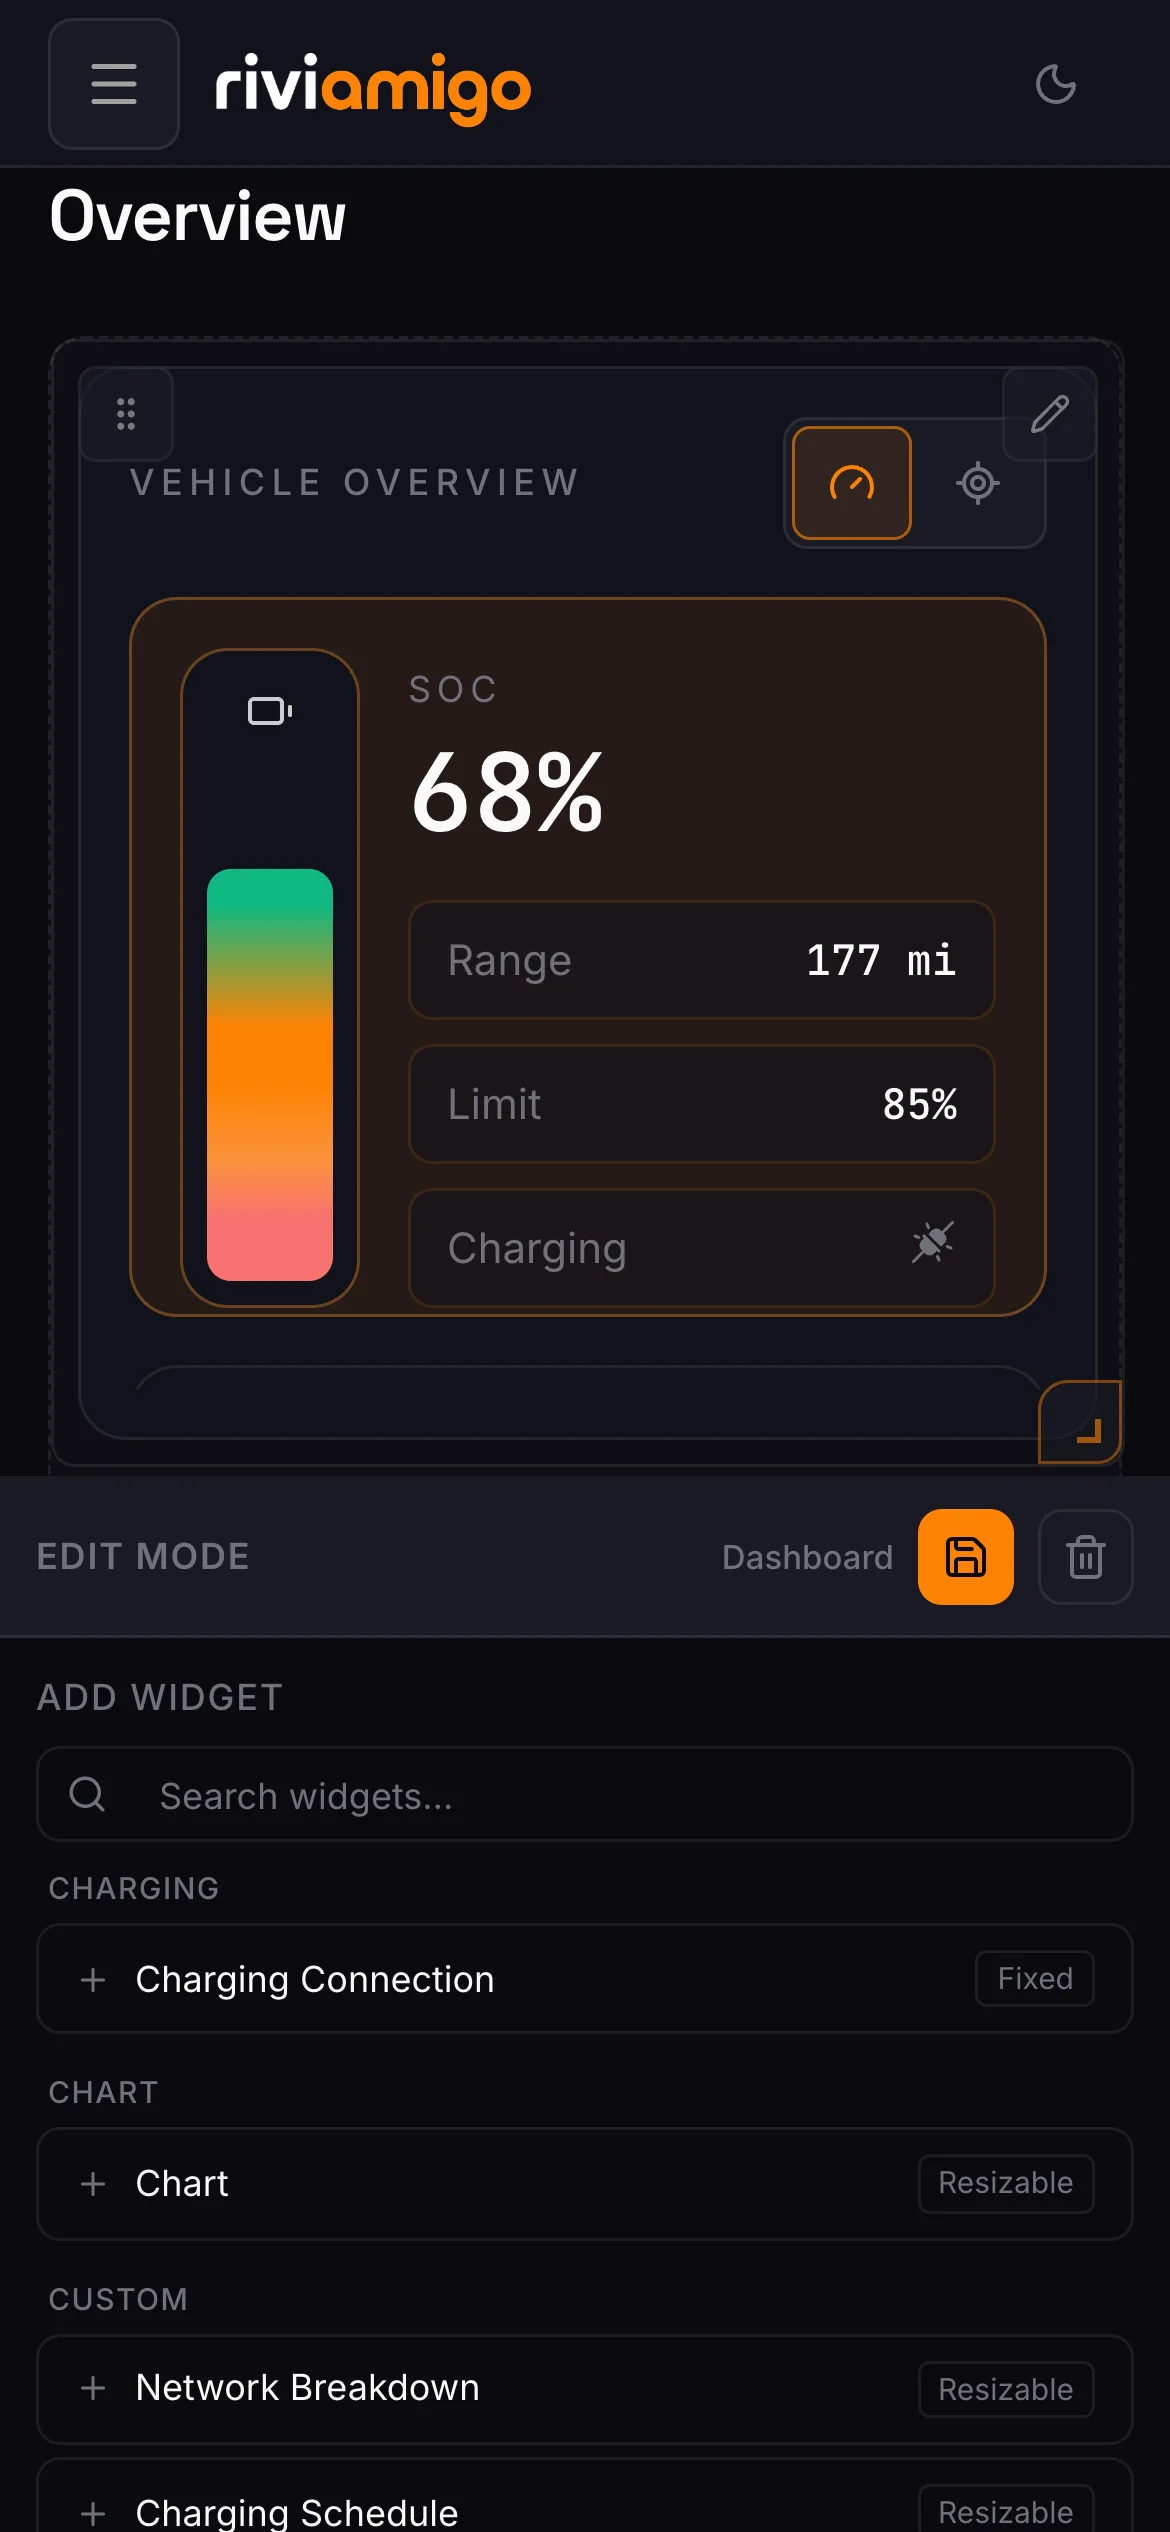
In edit mode, the editor drawer opens on the right. On a phone it opens as a panel along the bottom of the screen instead.
Move, resize, and remove widgets
Each widget gets three controls in edit mode:
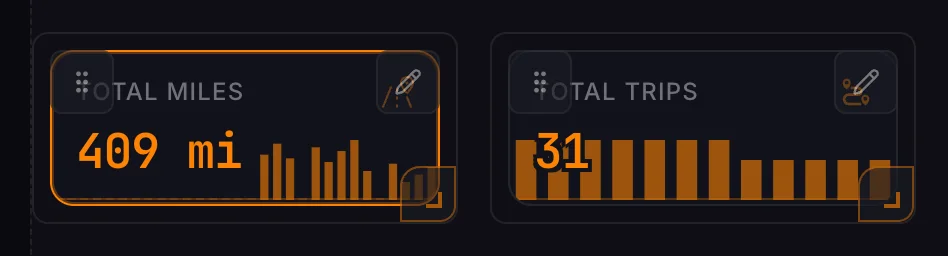
- Drag handle (top left, six dots): drag the widget to a new place. The other widgets move out of the way.
- Settings pencil (top right): open the widget's settings in the drawer. Click it again to close them.
- Resize handle (bottom right corner): drag to change the widget's width and height.
The grid is 12 columns wide, and widgets snap to whole columns and rows. Widgets marked Fixed in the catalog, such as Charging Connection, keep their size and show a lock instead of a resize handle. On screens narrower than 640 pixels, the dashboard shows widgets in one column, in grid order, and each one grows to fit its content.
To remove a widget, open its settings and press the trash button next to Component at the top of the drawer. You will be asked to confirm.
Add a widget
With no widget selected, the drawer shows Add widget: every widget you can place, grouped by category (Charging, Chart, Custom, and Sensors), with a search box at the top. Each entry is labeled Resizable or Fixed.
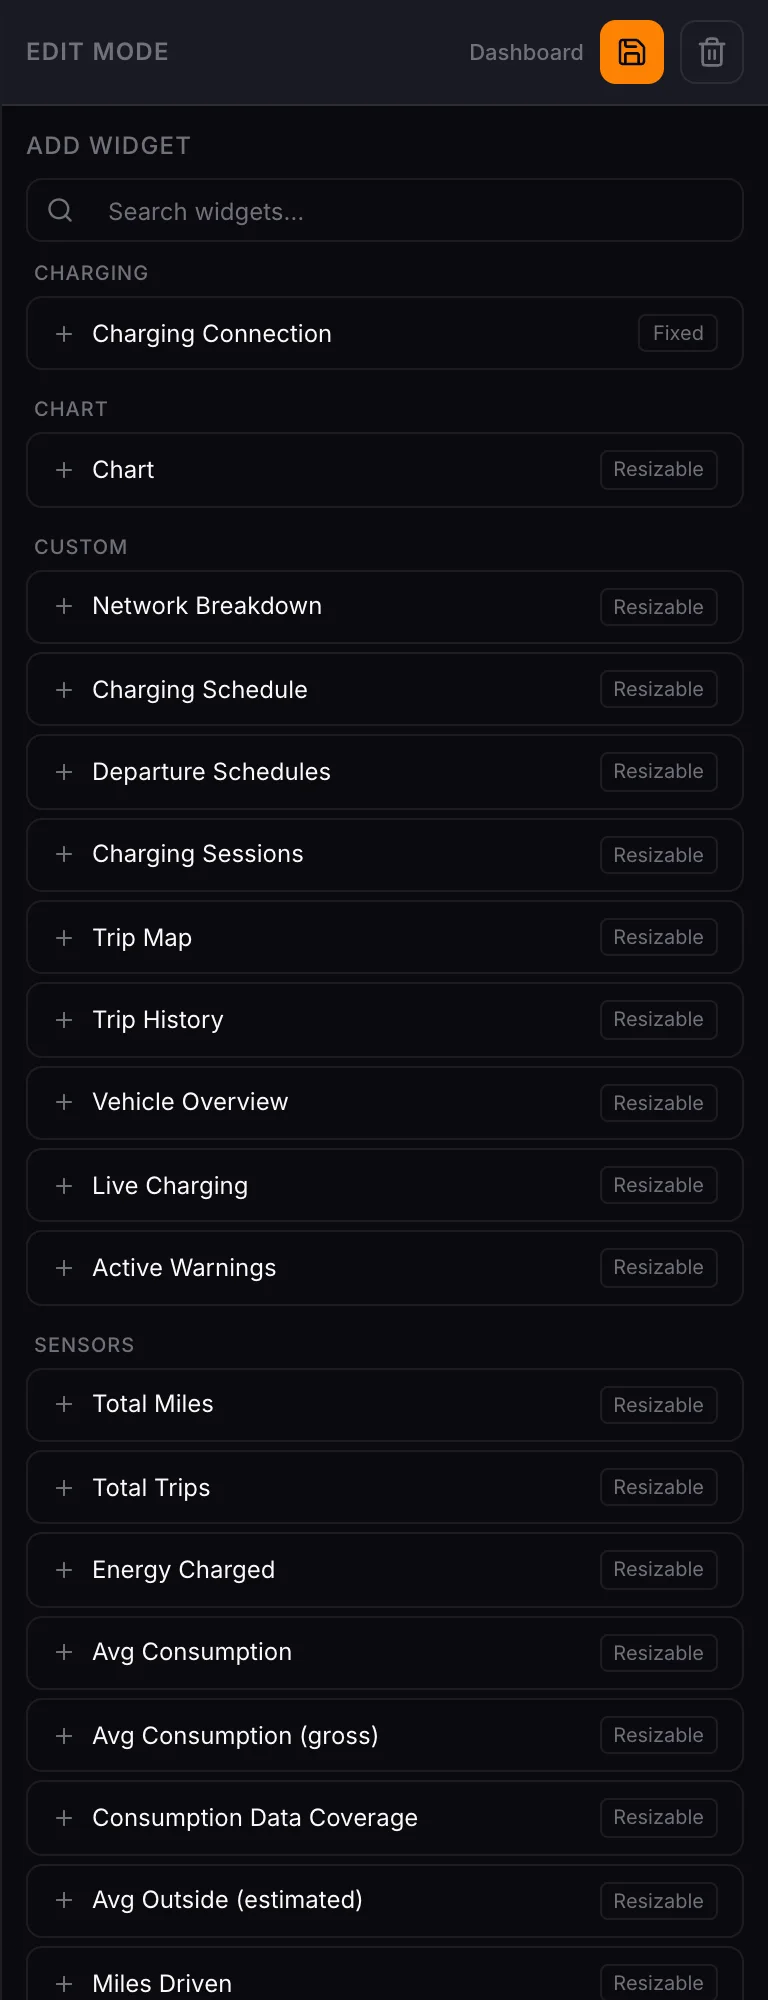
Click a widget to add it. It appears at the bottom left of the grid, ready to drag into place. Any widget can go on any dashboard. For example, you can add a Charging sensor chip to the Overview page.
Change a widget's settings
Click a widget's pencil to open its settings. The drawer header shows the widget you are editing. Widgets at the top left returns to the catalog. The settings depend on the widget:
- Every widget has a Title and a Visibility setting.
- Sensor chips add their icon, value, wording, and background graph. See Sensor chips.
- The Vehicle Overview adds its five stat rows and the location map. See Vehicle Overview.
- Charts choose which charts the widget offers. See Chart widgets.
- Most widgets have an Advanced (raw JSON) or Custom config (JSON) section at the bottom with the widget's stored options, for anything the form doesn't cover. Edit the JSON and press Apply JSON. JSON that doesn't parse is rejected with an error and nothing changes.
Changes show on the grid right away. The save button next to Component closes the widget's settings. Your changes stay in the dashboard draft until you save the dashboard.
Show a widget only when plugged in or unplugged
The Visibility setting decides when a widget appears:
- Always
- Vehicle plugged in: shown while a charging cable is connected, including when the vehicle is connected but not charging.
- Vehicle unplugged
The Charging dashboard uses this to swap layouts. While the vehicle is plugged in, the Charging Connection panel takes the space that some sensor chips use while unplugged. Two widgets can share a position as long as they never appear at the same time.
When a dashboard has widgets like this, the drawer shows Scenario preview at the top. Switch between Plugged in and Unplugged to arrange each layout. The preview doesn't change any vehicle data and isn't saved. Widgets hidden by the current preview stay in the draft, so arranging one layout can't delete the other.
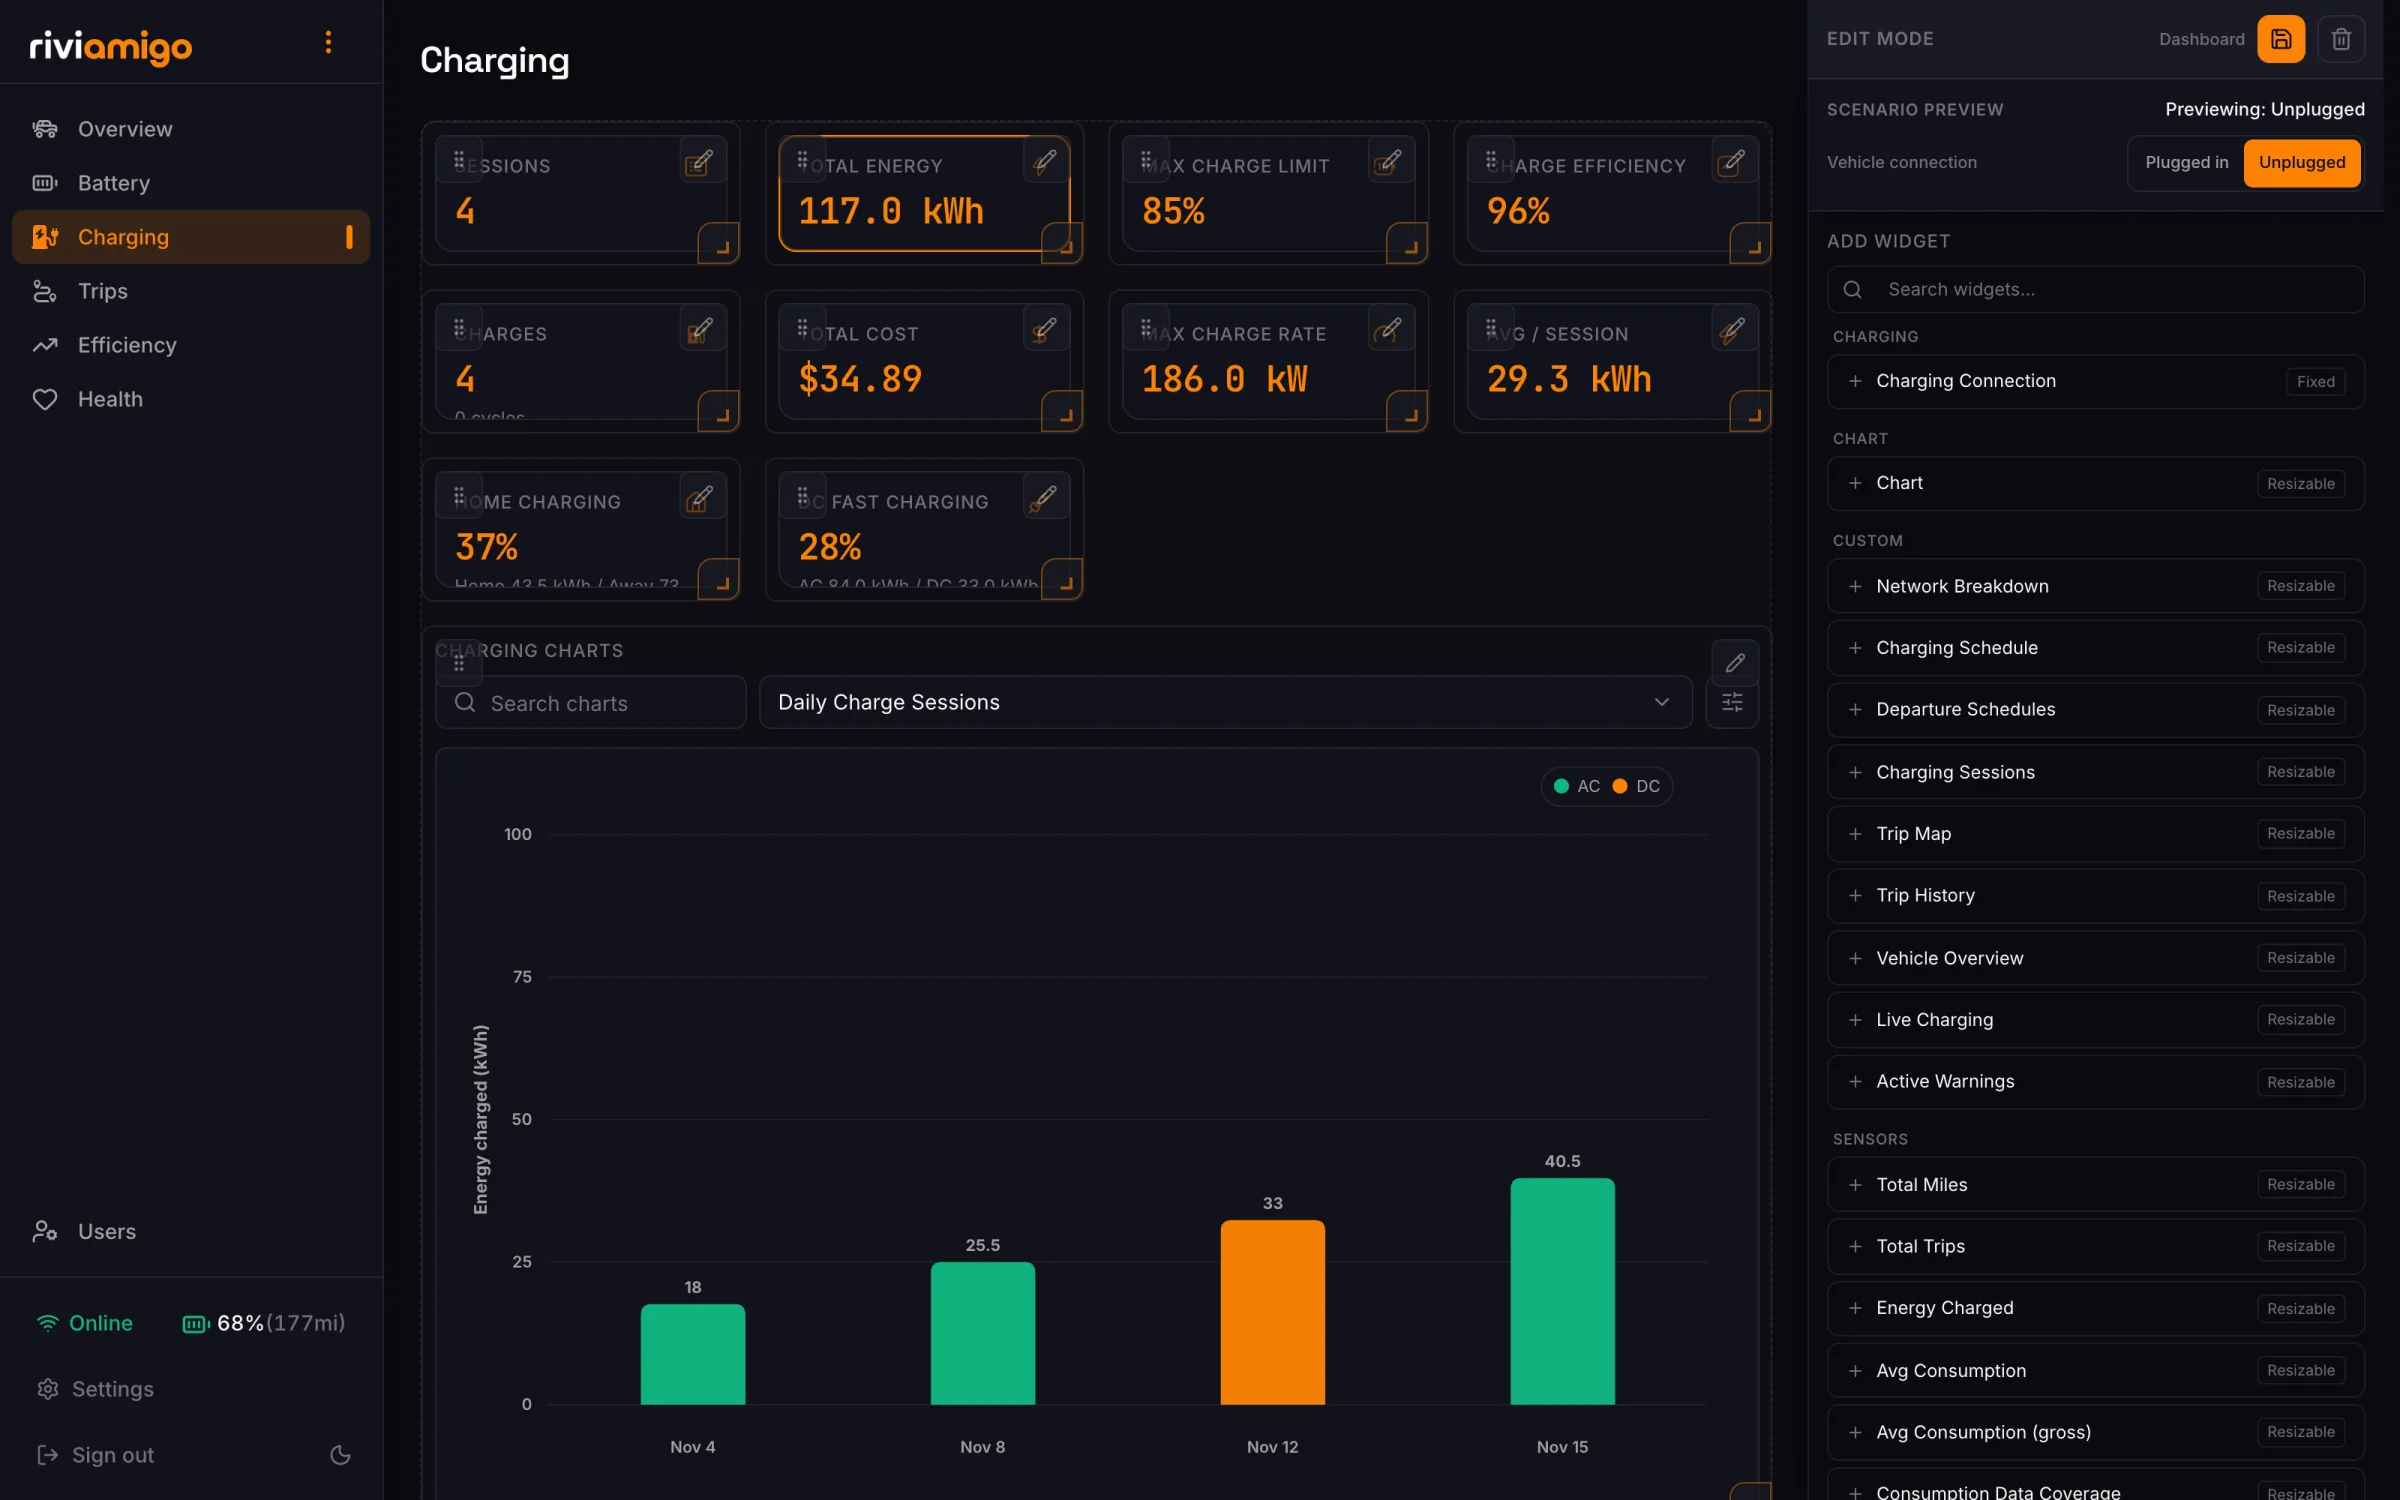
Chart widgets
A chart widget shows one chart at a time, with a dropdown and search box to switch between related charts. In its settings:
- Group limits the dropdown to the charts for one page (Overview, Battery, Charging, Efficiency, or Trips), or All charts.
- Default chart is the chart the widget opens on.
- Show chart dropdown inside widget turns the dropdown on or off.
- Available charts picks exactly which charts the dropdown lists.
Outside edit mode, you can also hover a chart in the dropdown and click its star to make it your default for that widget. The choice is saved to your account.
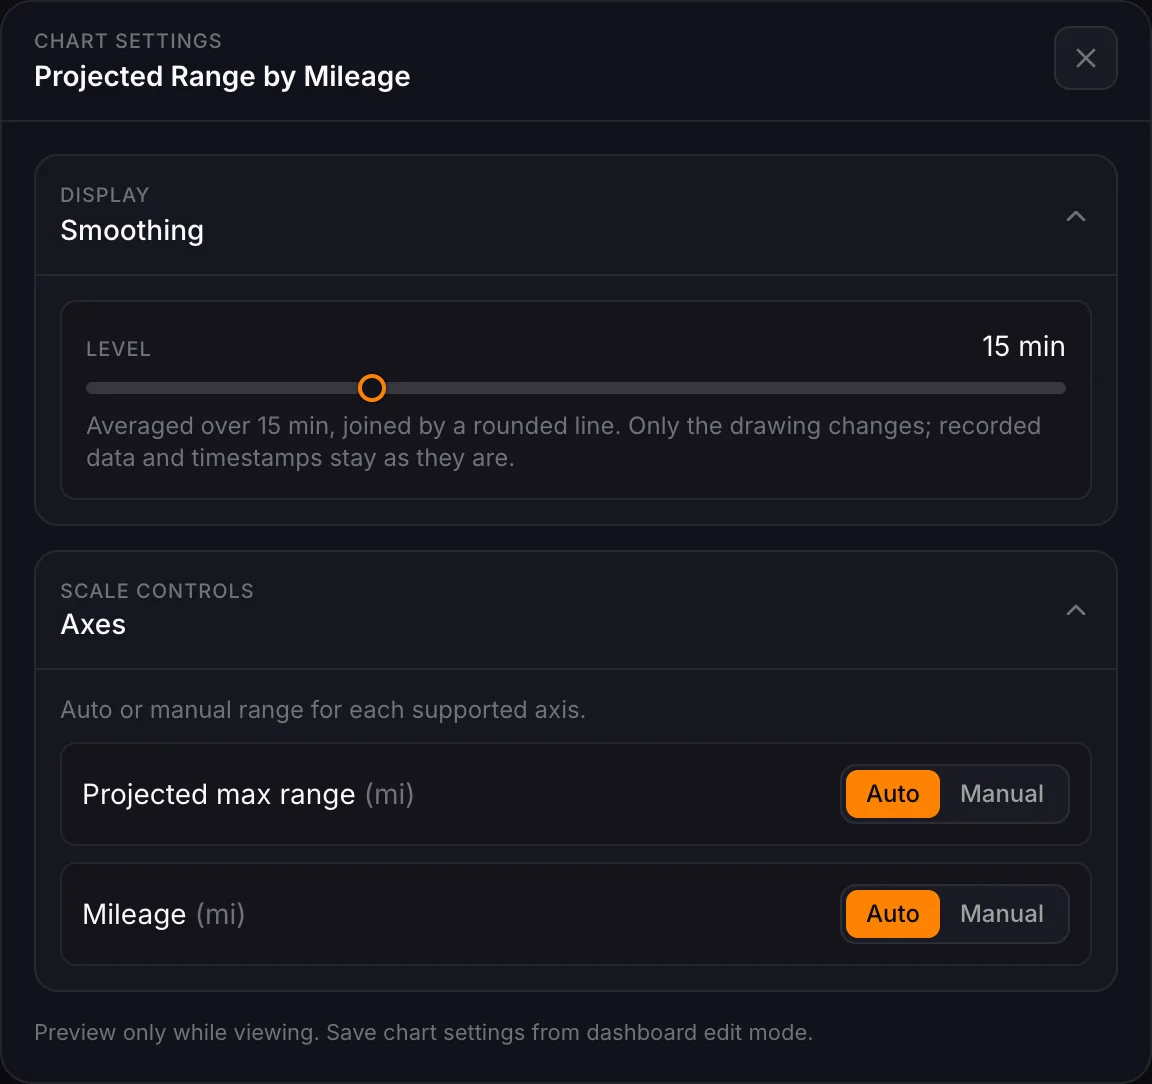
The sliders button beside the dropdown opens Chart settings for the chart on screen. It has Smoothing, which goes from Off through Curve to time windows from 15 minutes to 7 days, and manual or automatic axis ranges. These are previews while you're viewing. Save them from dashboard edit mode to keep them.
To change a chart itself (its series, colors, axes, or a brand-new chart), use the chart editor in Settings > Charts. See Chart customization.
Save or discard
The drawer's top bar has two buttons:
- Save (the orange disk) saves every change and leaves edit mode. The label beside it reads Unsaved while there are changes to save.
- Discard (the trash can) throws away every change since you entered edit mode and leaves edit mode at once, without asking.
If a save fails, your edits stay open and an error explains why, so nothing is lost.
Edit on a phone
Edit mode works on a phone too. The drawer becomes a panel along the bottom of the screen, and every setting is available. Dragging and resizing are easier on a tablet or computer, where you can see the whole grid.
Start over
To return a dashboard to how it shipped, use Reset to default on your personal copy, or Restore bundled on a system default if you are an administrator. See Manage dashboards.